Use Filters for Analyzing results
Filters contribute to a more detailed analysis of your responses. With filters you set a specific condition to get the answers you are looking for. This can help you achieve better results and improve your analysis.
We have three ways to filter your responses:
-
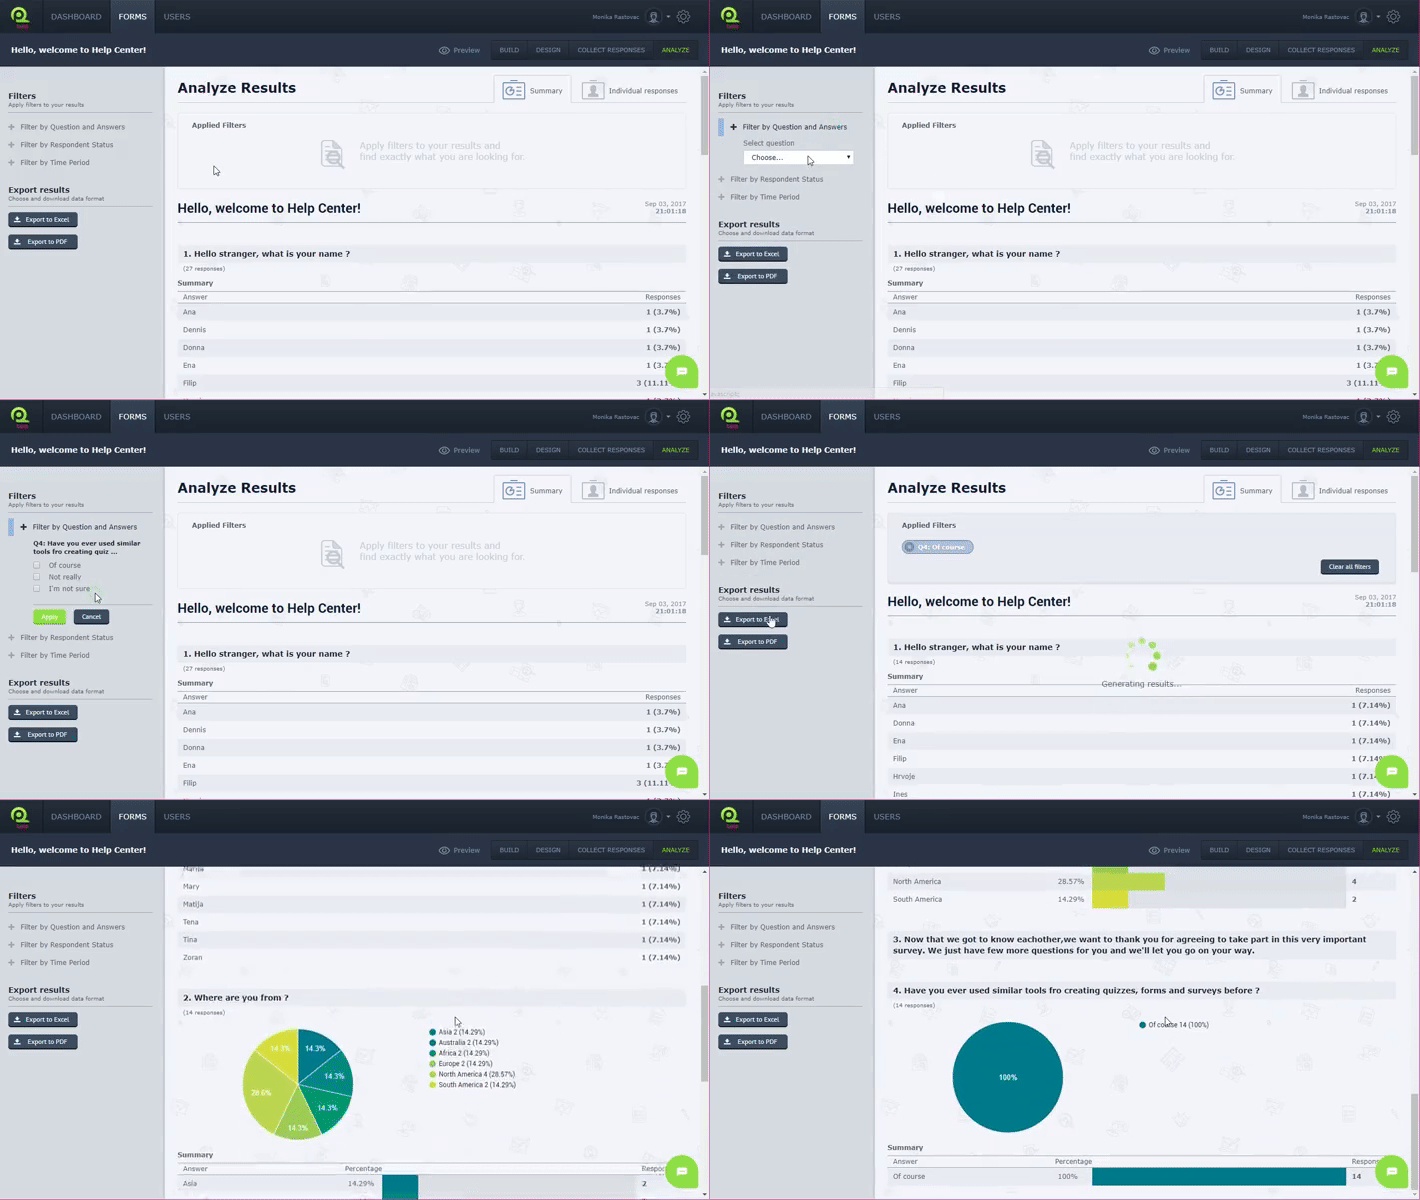
Filter by Question and Answers
This filter allows you to analyze your form to specific questions and answers.
For example, if you want to know how people answered the question “How would you rate your level of satisfaction with us?” choose this question in your filters and you will see the results. You can be more specific so you can choose this question and add that you want to know how many people answered that question to “highly satisfied”.

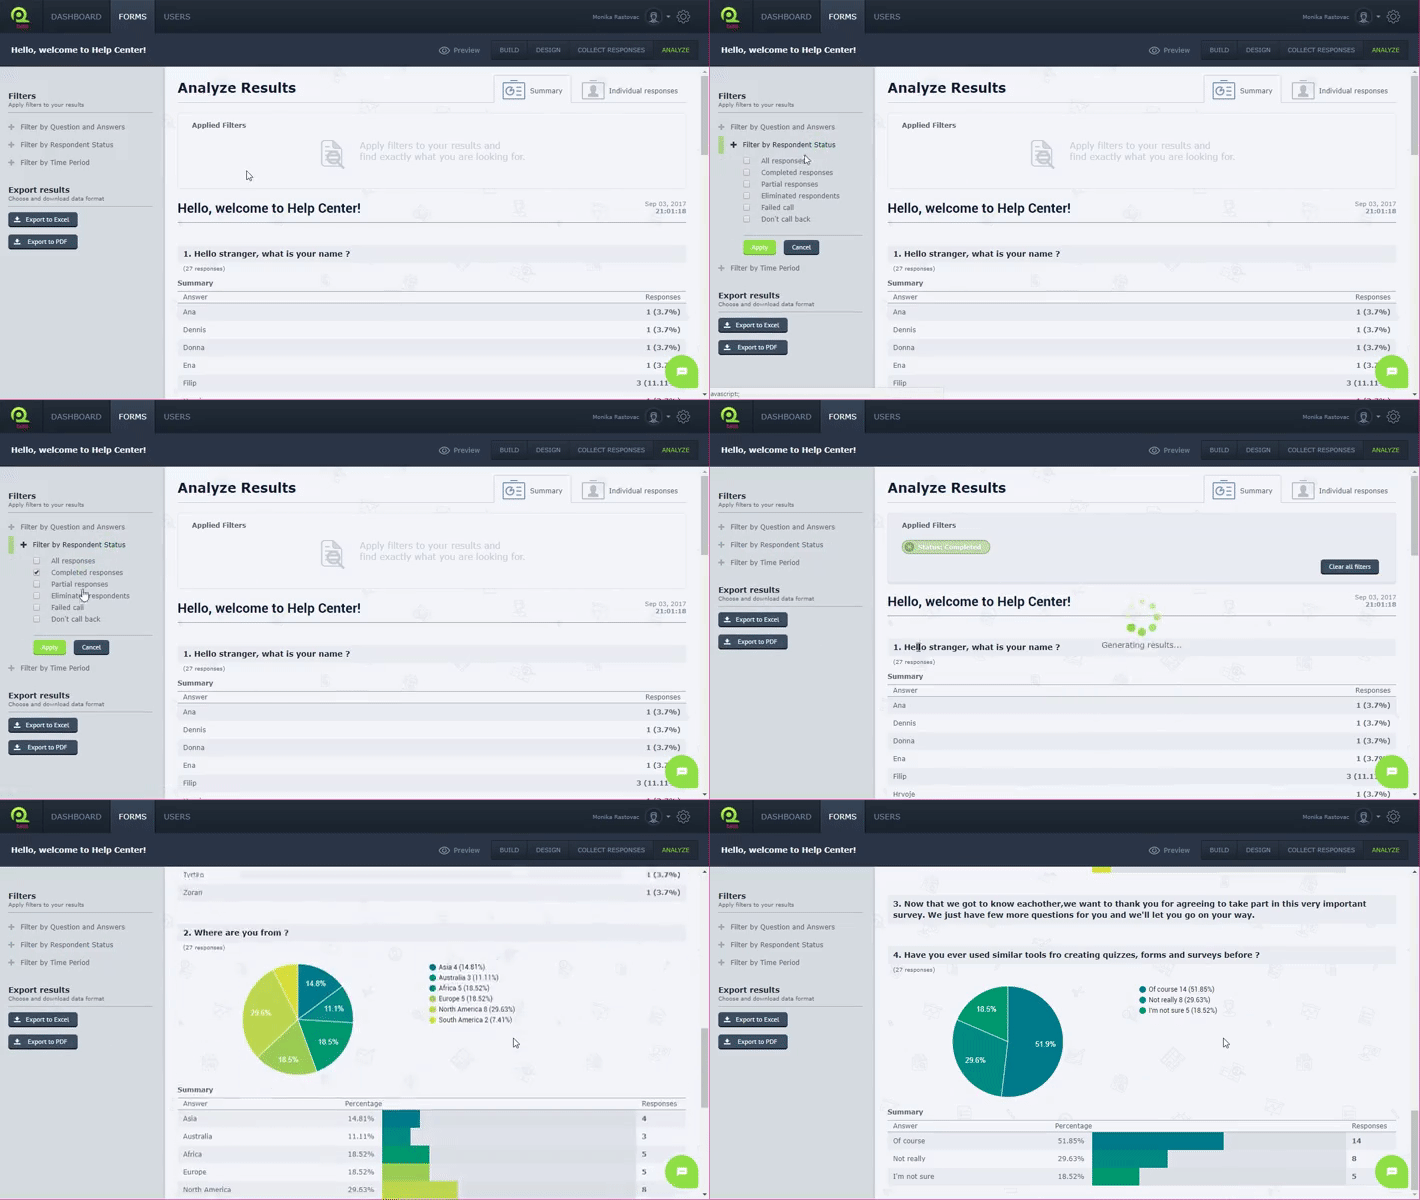
- Filter by Respondent Status
This filter will show you one of the Respondent Status: All responses, Completed responses, Partial responses, Eliminated respondents and more.
For example, if respondent entered at least one question their answers are partial, if respondent answered all of the questions their Respondent Status is All responses.

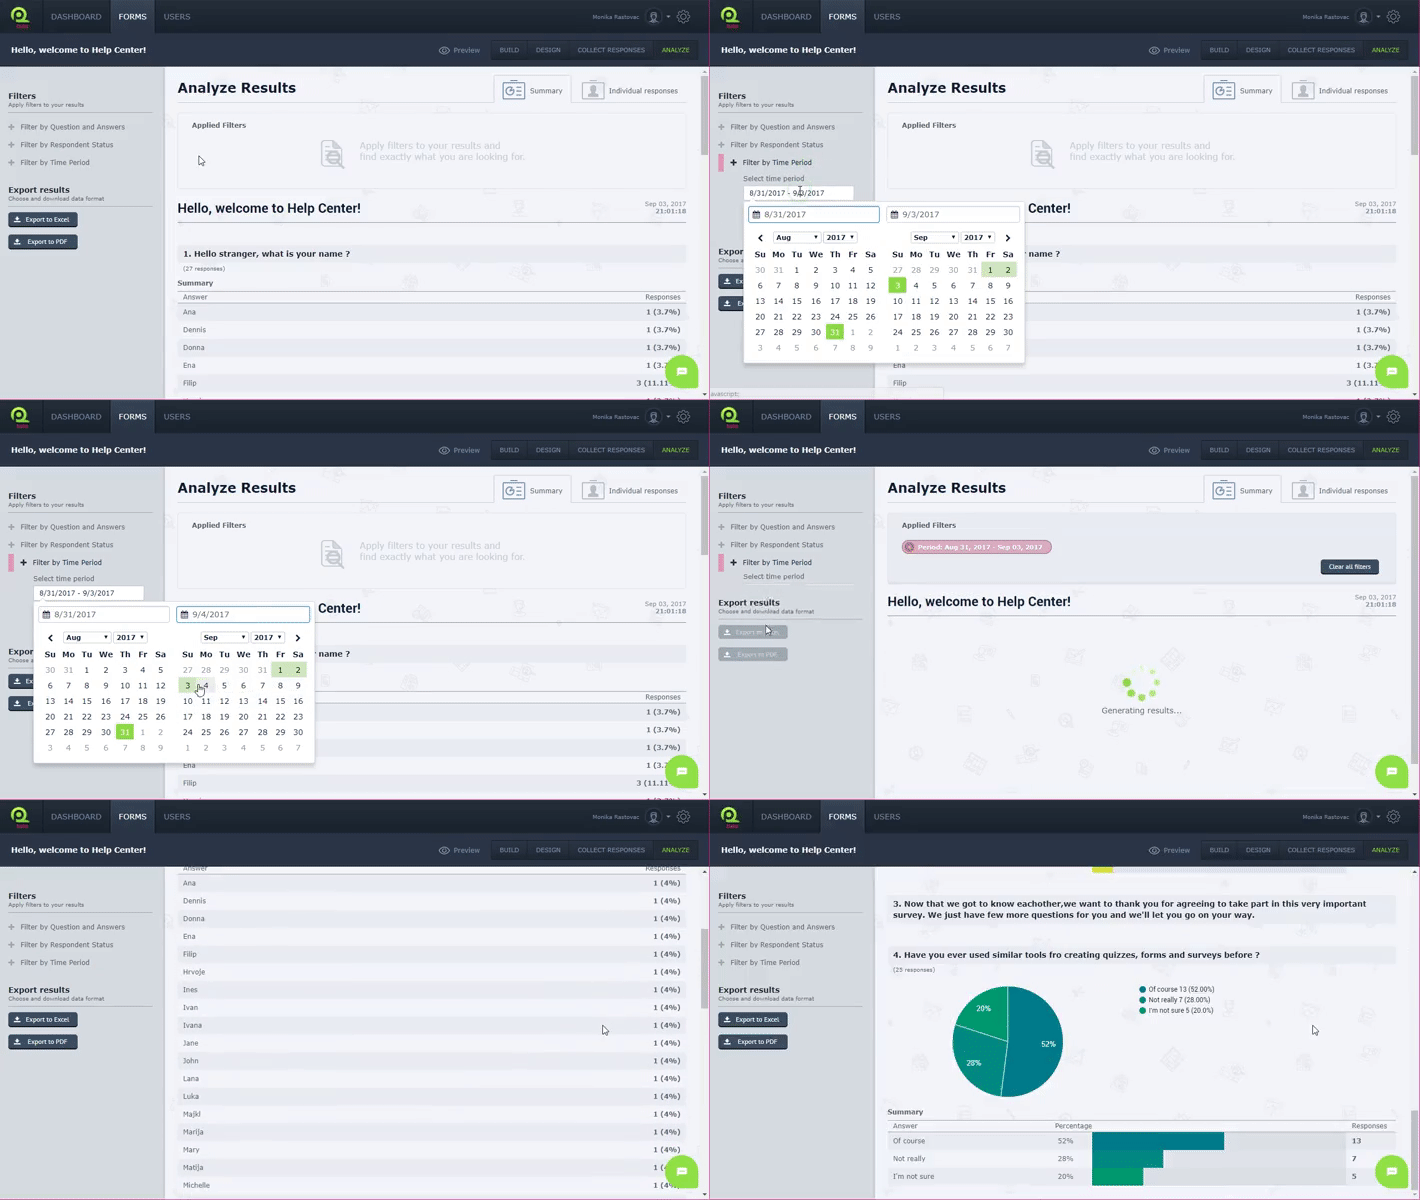
- Filter by Time Period
Filtering by time allows you to see results collected in certain period.
For example, if you are interested in the results collected in June, enter the dates and you will see results.

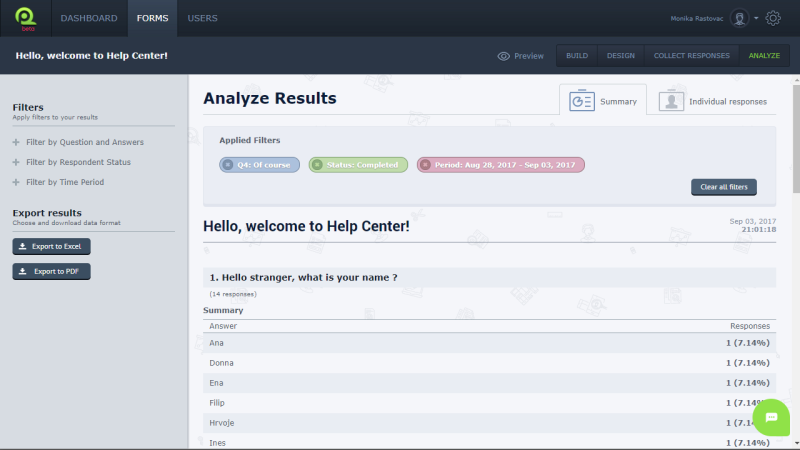
You can combine and add different filters, or delete added filters. When you add more filters, QPoint uses the “AND” logic, which means that we’ll show you respondents who respond to all your filter criteria.
For example, if you as filter put "How often do you come to our restaurant" and answer "Very often" and add as filter "How likely is that you will recommend our restaurant to a friend, colleague or customer" and answer “Very likely" we will show you the results of only those respondents who have respond to you that they come to your restaurant very often and who will very likely recommend your restaurant.

To Use filters in your analysis:
- Log in
- Choose Forms in Menu bar
- Choose your form
- Choose Analyze in Toolbar
- Choose Filters in sidebar on the left