Analyzing responses
Setting appropriate and right questions will give you the results you need. The important part of the surveying is filtering and analyzing the collected results.
The only thing you have to know is to read and use our simple, easy and transparent analysis we have done for you.
You do not need to draw diagrams, use different research methods, or waste time - the results you need are shown numerically, by percentages and by drawing diagrams - all done for you! Filter collected data based on answers, status and time period.
You have the option of detailed review of your responses using different filters, individual responses (also numeric, by percentages and diagrams), and a summary of the entire form. You can also generate and export (Excel or PDF) reports for more advanced analysis.
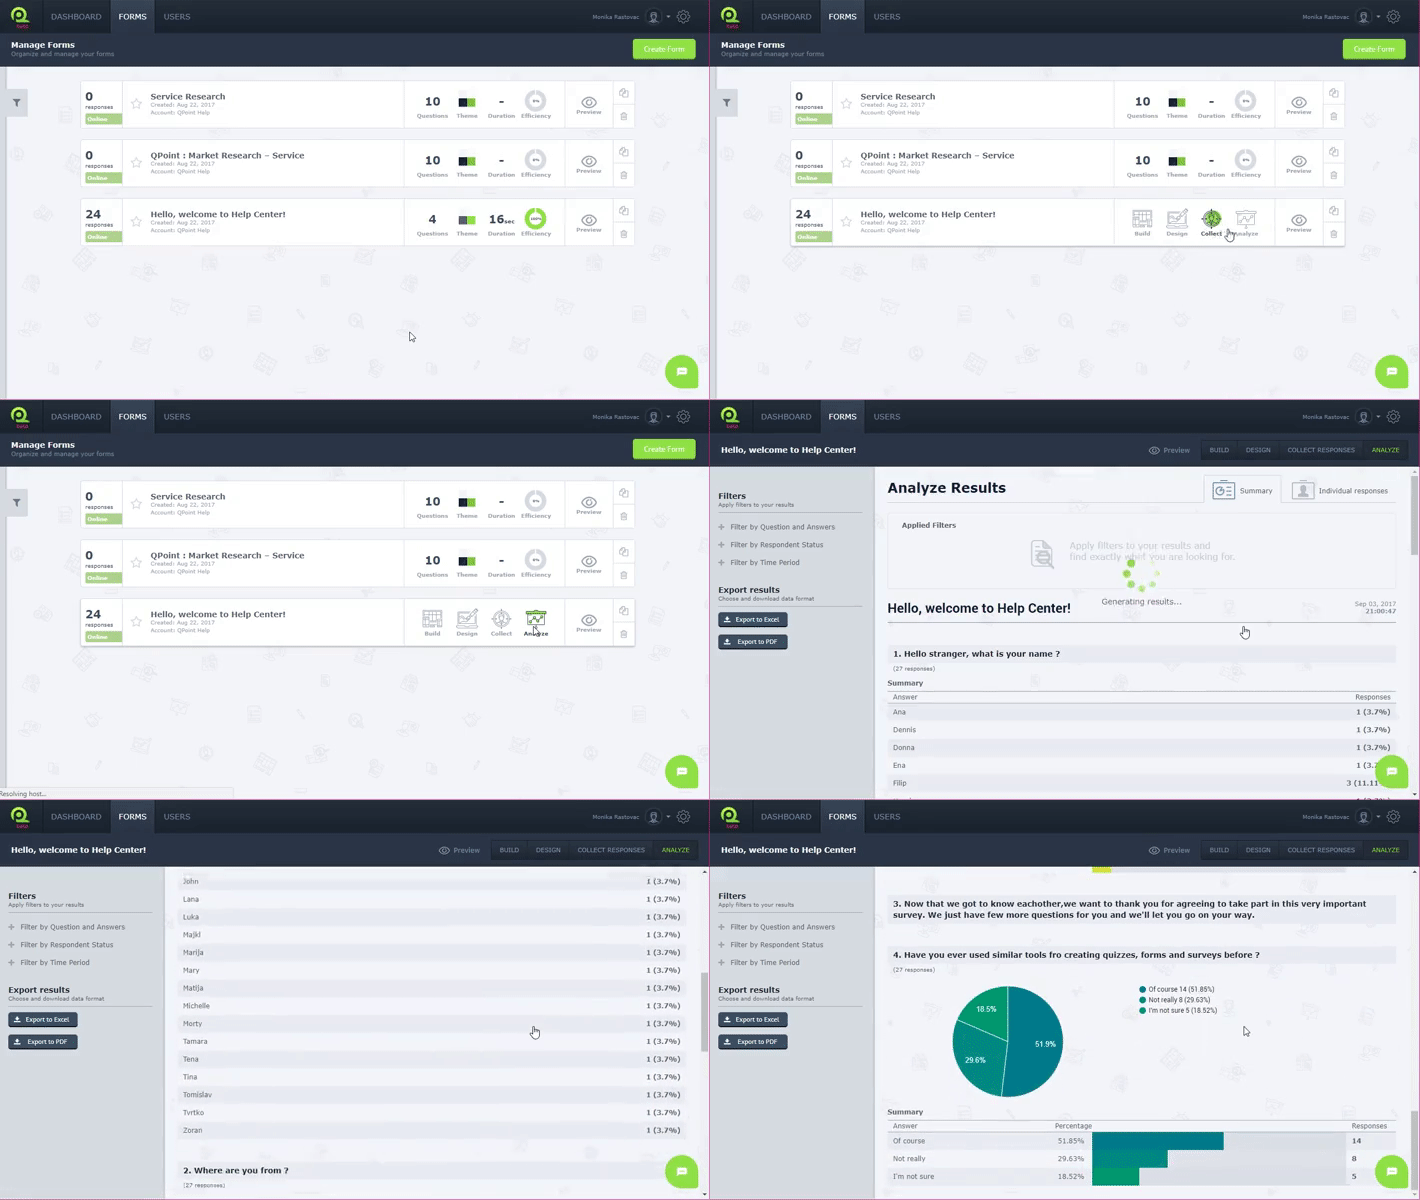
To Analyze results:
- Log in
- Choose Forms in Menu bar
- Choose analyze in Status bar of your form

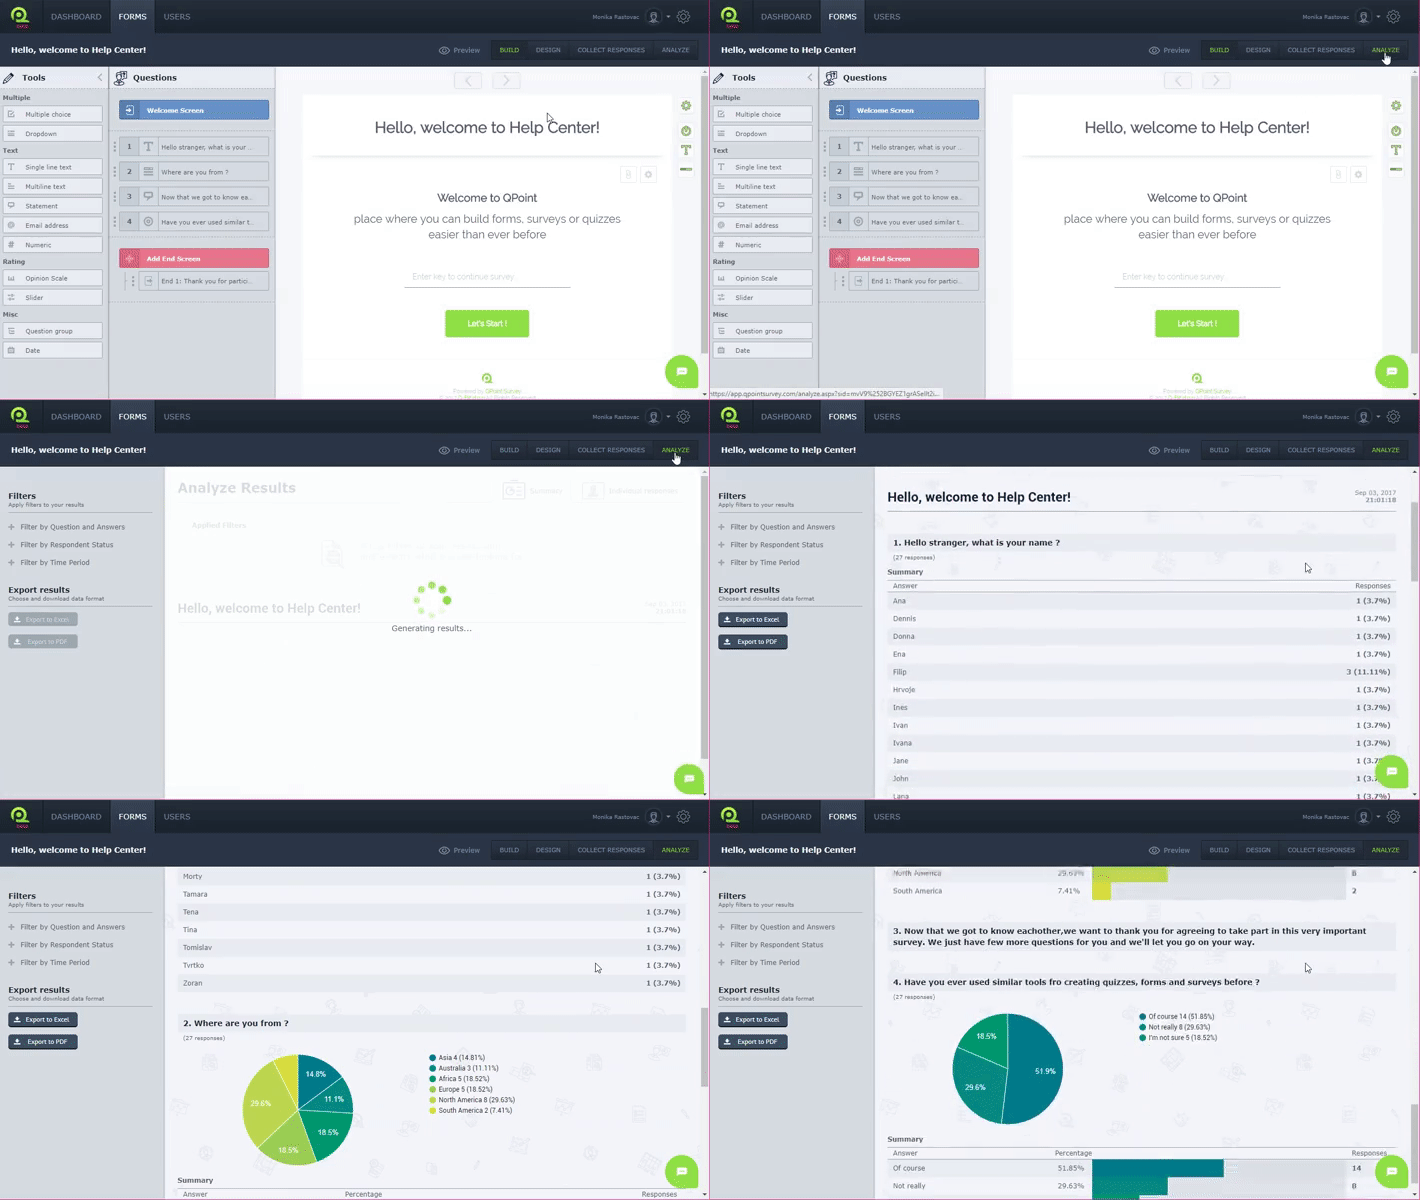
Or
- Log in
- Choose Forms in Menu bar
- Chose your form
- Choose Analyze in Toolbar
